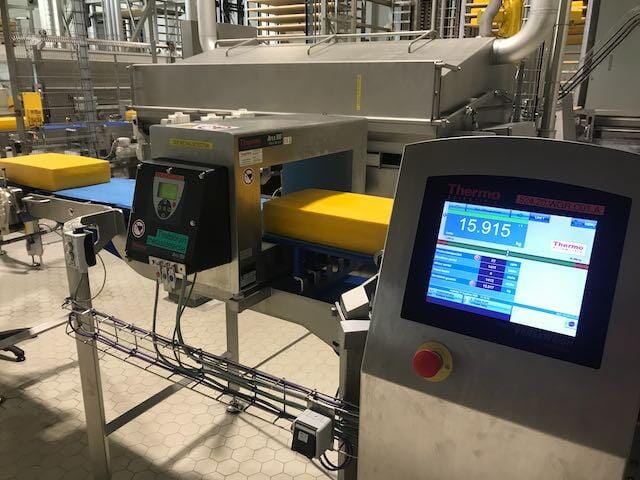
Use Case: Optimizing cheese weight
Without process metadata, it’s difficult to identify trends and draw conclusions from production data.
It often just seems like unexplained, random fluctuations in the process.

When you thoroughly understand the process, you know which factors might influence the product. For example, process parameters that affect the weight of a cheese include:
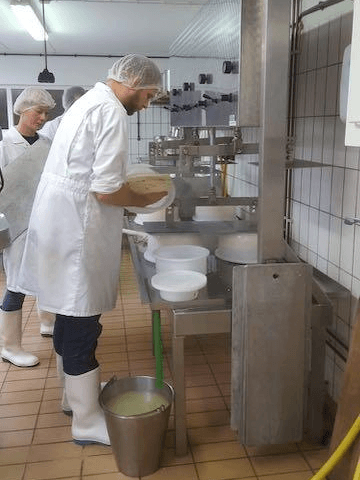
- the process in the cheese vat,
- the adjustment of the columns, or
- the holding time after the vat is emptied (visible through the cut number).
Once we were able to link the cheese weights to process metadata, we analyzed the weights based on these parameters. Suddenly, clear trends emerged: the vats were nearly identical, but there were differences between the columns, and the first two cuts from each vat were significantly heavier.


This is valuable information for a cheese technologist – the process was adjusted the very same day.

Project executed by Tom Mentink


