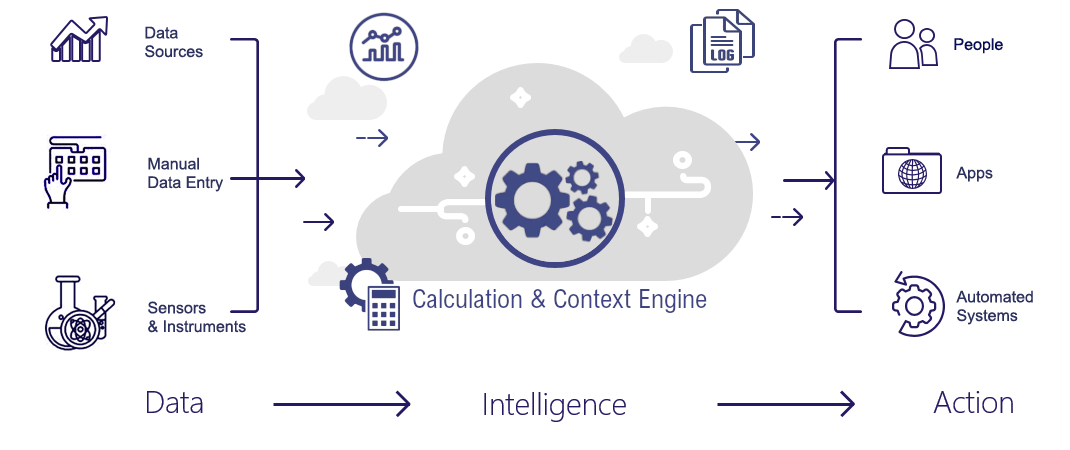
Having a structured, real-time contextualized database in HAI, the possibility of applying solutions with Artificial Intelligence come within reach. That’s why HAI includes advanced analytic features and even features for Artificial Intelligence and Machine Learning. Alternatively, you may wish to connect a real-time data stream from HAI to your own Analytical Program.
This could for instance be used to discover how process conditions affect the quality of your end-product, or it could be used to develop a predictive model.
Once, such a model has been developed and tested, it can be put to use in the HAI-LOGSHEET, which makes the model part of the daily operations. Through a continued (user)feedback loop to the original AI model, there is a continuous improvement cycle for the model.
Unlock the power of your data, by applying the Advanced Analytics Capabilities to discover and develop advanced control models that are incorporated as a Smart Factory App as part of the HAI-LOGSHEETS. The app supports plant personnel with for instance process adjustment advices.
A Smart Factory App has been developed to improve sustainability, quality and yield in cheese production (1% yield improvement reflects an amount in the range of 100,000 – 500,000 euros a year). More information: https://hai.nl/news/hai-wins-with-team-notilyze-sas-hackaton-2023/
Another appealing example is a Smart Factory App to reduce energy consumption (and CO2 emissions) on a destillation process, while optimizing for quality and yield. More information: https://hai.nl/news/winning-the-worldwide-sas-hackaton/


