Using Data to make a difference
Graphs, Analyses, Metrics and Dashboards to harness the power of data
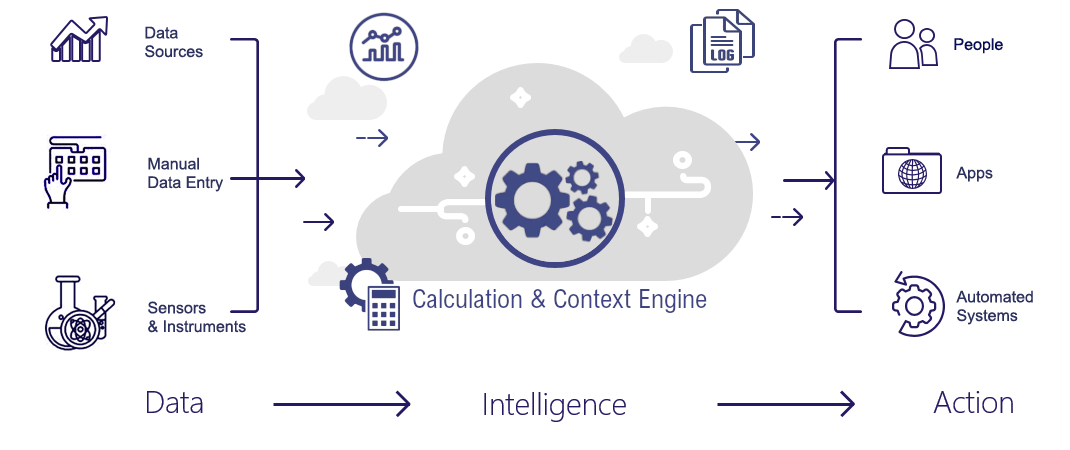
Whether it’s about your factory’s Quality, Process, Energy, Water, Production or CIP, HAI offers a powerful, yet easy-to-use system. It presents automatically collected data along with operator control input fields.
Powered by smart dashboards with trending, reports and analytics, it helps to understand the data and its implications. The power of data is now at the finger tips of operators and staff members alike.
Plant BI (business intelligence) for Smart Factories
BI (business intelligence) systems for financial purposes have been available for quite some time now. And these applications have paid off.
Strange enough, little attention has been paid sofar to apply this success for smart factories on plant data.
This is now changing with the availability of a full blown Plant BI application from HAI.
Real-time compliance monitoring, including contextual data for Smart Factories
The real-time dashboards show data on product quality, production and processing conditions. Individual data are completed with related data from other sources, resulting in a meaningful and comprehensive display.
Hence, it gives you a helicopter view on compliance and you will identify easily any anomily.
Real-time Trending and Early Warnings for Smart Factories
Real-time trending of product quality and processing conditions is important for operators. It allows them to closely monitor their processes and serves as an “early warning system” to prevent out-of-spec situations.
Finding causes for “non-quality” in Smart Factories
The HAI software enables correlations- and causality-studies to identify (multivariate) relationships between raw materials characteristics, process conditions and end-product quality. Especially the development of a tool to identify the most probable causes for non-quality was a challenge to our team. Yet, it has resulted in an easy-to-use feature to support trouble shooting process engineers.
Dashboards for Smart Factories
Dashboards give real-time information on trends and Key Performance Indicators (KPI’s), Quality Performance, Adherence to Plan, etc. This may concern Operator Production Dashboards, Quality Dashboards or Management Dashboards.
Statistical Process Control (SPC) for Smart Factories
Statistical Process Control (SPC) is a succesful method to apply statistics in process control with the objective to produce the best possible quality in the best possible conditions.
Trending of data over a longer period of time reveals interesting information for process engineers, quality engineers and trouble shooters.
Use the automatic calculations of Process capability (Cp and Cpk) to evaluate and prove product quality consistency performance.
OEE for Smart Factories: real-time and easy analysis
OEE is an important Key Performance Indicator (KPI) for Smart Factories. OEE (Overall Equipment Effectiveness) is a metric to assess your factory performance. It includes Availability Performance (downtime monitoring), Speed Performance (speed losses) and Quality Performance (rejected batches, inferior quality).
By measuring OEE and its underlying losses, you’ll have important insights on how to systematically improve your production and packing processes. OEE is the single best metric for identifying losses, benchmarking progress, and improving the productivity.
Important prerequisite of reliable OEE measurements is to automatically collect the data instead of relying on manual operator records. Just as important are features for real-time feedback to operators and user-friendly flexible analysis and reporting capabilities.