Manufacturing applications

Software for

Production and Quality Compliance & Operational Excellence

Paperless Plant & Paperless Lab

Manual quality inspections and operators control sheets are implemented in the HAI database. This may concern at-line quality inspections (mobile devices), start-up checklists, weight control (E-mark), downtime allocation, production volumes, operator logs, etc

Along with lab test results, and hygiene and food safety records, it forms a complete database for production and quality inspections. Thus creating a paperless plant and a paperless lab.

Automatic data collection

Want to have a real-time and historical visibility of your factory and quality inspection data?

Your PLC/SCADA systems contain information about batch runtimes, downtimes, processing times, speed, temperatures, pressure, flow rate, energy consumption, etc. This information is automatically collected in the HAI database. Along with automatic data from lab instruments, in-line inspection equipment, weighing scales, counters, remote sensors, test results from external labs, etc.

OEE, Real-time adherence to Plan, Weights (E-mark)

HAI automatically connects to production orders from ERP or MES systems.

Downtimes are recorded and accounted for during production, including a real-time OEE calculation and downtime analysis. Production progress is shown in real-time, and visualized along with the planning.

Weight control and optimization is done in line with E-mark legislation.

Batch Release and Tracking & Tracing

For a reliable and efficient batch release it is vital to have all batch information easily accessible. In the HAI database all information necessary for batch release, is only one mouse click away, indicating compliance & exceptions.

In case of complaints or product quality issues, it is important to have quick access to historical data. This includes QC data of raw materials, intermediates and finished products, as well as QA activities, external lab results, process compliance and operator logsheets.

Real-time Compliance, Early Warning system

Visualization of deviations is important to secure awareness and prompt action from operators and quality personnel. This includes out of spec situations on product quality and deviations in production protocols, QA activities, production speed and progress, energy consumption, etc.

Actual out-of-spec situations are highlighted. Moreover, the HAI software includes also early warnings before out of spec situations arise (SPC, SQC).

CIP optimization      (Cleaning in Place)

Cleaning and sanitation protocols, schedules and activities are recorded in the HAI database to secure and monitor compliance.

As for CIP-activities, the HAI software includes tools to monitor CIP efficiency and effectiveness.

Moreover it includes tools to identify CIP cost saving opportunities. This may concern the CIP duration, the CIP frequency, temperatures, consumption of water and chemicals, etc.

Mass balances,              Yield optimization

For the calculation of mass balances and yields, it’s vital to have detailed, accurate and frequent measurement data from your tanks and processing equipment.

The HAI software automatically collects these data, incl. raw materials usages, tank levels, flow meters, dry matter contents, calculations from litres to kgs., etc.

This results in real-time insights to identify unknown losses, evaluate cost-prices, and optimize yields.

Golden Batch

A Golden Batch is defined as the time-based profile of the process parameters that were recorded for a particularly succesful batch, in terms of duration and quality.

The HAI software facilitates the definition of a Golden Batch and operator real-time monitoring of the current batch versus the Golden Batch.

Moreover, Process Technologists use Golden Batch Reporting and Analysis to maximize process efficiency.

   What you’ll have

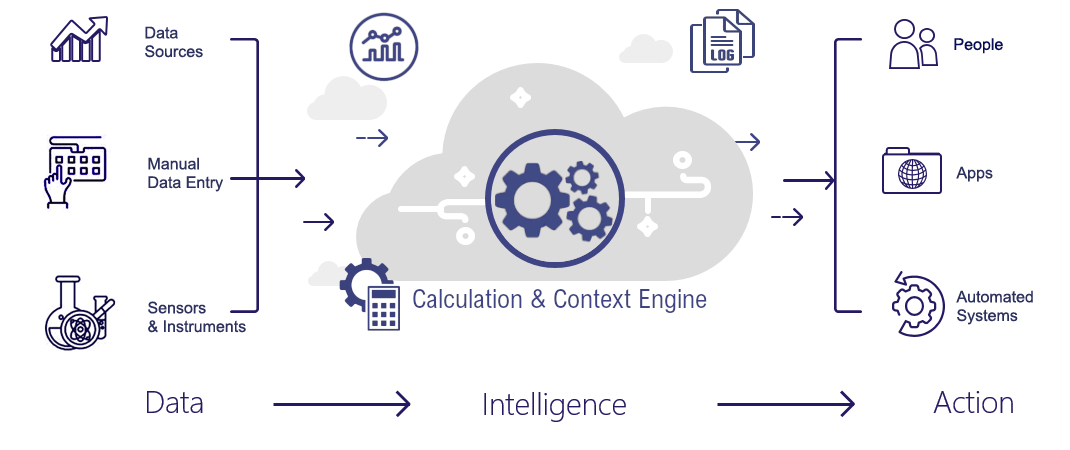
  • An extraction of your MES historian data is brought to the Cloud and completed with data from other (PLC’s) production processes, Testing equipment, Operator logsheets and Quality test results.Data is put in context with product &  batch numbers, resulting in a cloud database with valuable information on your production processes.
  • An all-in-one Dashboard for operators combining automatic data from SCADA and Quality, with manual operator control data entry fields, and automatic KPI’s
  • Real-time compliance-trending/SPC
  • Real-time OEE (Overall Equipment Effectiveness), weight control (E-mark), production adherence to plan
  • Real-time statistical calculation of corrective actions to prevent out-of-spec (early warning system in production)
  • A quick & smart trouble shooting tool on historical data (in context)
  • Statistical Analyses to find correlations in your process, the golden batch, multivariate analysis, PCA, etc. to identify  process improvement opportunities, etc.
  • A great tool for cost price validation
  • Predictive analytics on your end-product quality, based on in-line measurements

   Your benefits

  • No more operator excel sheets and operator paper control sheets
  • Ability to run your factory smarter then your competitors
  • Unparalleled insight into your plant performance
  • Prevention of out-of-spec, with early warning system
  • Quick & Smart trouble shooting results
  • Reduction of # rejected batches
  • Identification of optimum process settings for maximum output
  • Improvement of product quality consistency
  • Improvement of Plant Capacity Utilization
  • Minimum downtimes/maximum speed
  • Optimum weight control (in line with E-mark legislation)
  • Reduction of energy consumption
  • Engineers, R&D- & Quality staff have easy access to the data they need, and no longer waste valuable time to collect the data from various sources
  • Your reports and analyses become more reliable because there are checks on the validity of the raw data data 


Simply available in the Cloud … No capital investment … Subscription-based