HAI: The Digital Platform for Process Manufacturing

Data Driven Vision

HAI: The Digital Platform for Process Manufacturing

Integration, Contextualization and Visualization

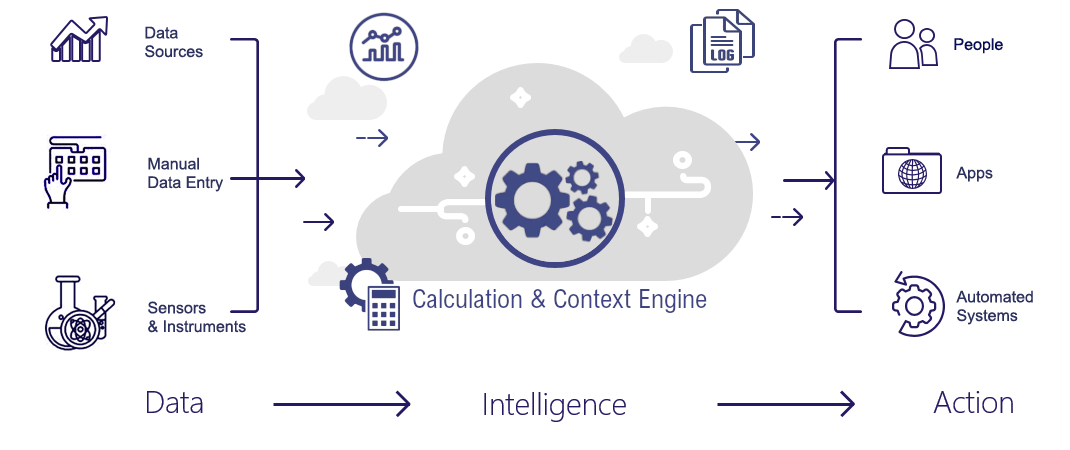
HAI is a real-time process manufacturing data hub—a first-of-its-kind cloud platform for integration, contextualization and visualization of process manufacturing data. It combines high frequency time-series data with contextualized event-data.

Sourced with plant- and operations-data from any source, the system provides real-time and historic information that is contextualized, thus immediately meaningful and actionable.

Powerful visualization without the need for IT specialists

The platform includes a powerful logsheet generator for visualization that is unique in its kind. It allows users to define and maintain their own smart logsheets without the help of IT-specialists.

Logsheets that present the automatically collected data, along with manual data-entry facilities, and automatic data calculations for reporting, KPI’s and AI-applications.

Outpace tomorrow

HAI provides the shortest way from a scattered IT/OT landscape to an integrated holistic view for each workplace and each purpose.
The platfom offers an accessible, manageable, and scalable path to drive your company’s digital transformation

The digital transformation helps to bring about increased efficiency, cost reductions and improved quality, and ultimately positions organizations for long-term success.

Microsoft_Azure_logo_PNG7

HAI: the Integration Platform as a Service

Securely (ISO 27001 certified) available as a Service (SaaS) in the Microsoft Azure Cloud, HAI needs no local infrastructure and software installation, and is available on any device and from any location.

The benefits

Ready to start in the Cloud

AdobeStock

start < 4 hrs no local infrastructure

Safe & Secure in the Cloud

ISO 27001 certified

Yearly subscription

no capital investment

Self-reliance

no vendor lock-in

HAI: the modules


HAI comes with standard connectors to a variety of data sources, for instance:


Once the connection between a data source and hai-app has been established, the system can be configured to define how the automatic data collection should take place, e.g.:

  • Access and location of the data
  • Data points (tags) to be collected
  • Data collection rules (triggers, automatic, calculations, etc.)
  • Frequency of data collection (high frequency data & event-based data)

Key-users are able to adjust the configuration of the automatic data collection without the need to involve an external expert. Self-sufficiency in software management is important because it makes you independent of a vendor. This allows for flexibility, cost savings, and shorter lead times.

The logsheets are a unique part of the software, cherished by users, and brilliant in its capabilities.
The logsheets are the screens where end-users view their information. What makes them special is that the logsheets combine a wide range of functionalities on a single screen, a.o. an Early Warning System to prevent out-of-spec situations.

In the logsheets, we can see:

  •  Real-time data visualization & trending
  •  Automatic data collection & Manual data entry
  •  Data in context
  •  Compliance with standards
  •  Raw Data & Calculated Data
  •  A mix of different types of data
  •  Powerful filtering in historical data
  •  Statistical Process Control (SPC)
  •  A statistical model

As a result, manufacturers can unlock all data from their primary production process (process data, quality, utilities) and offer it in a directly usable format in the form of logsheets. Custom-designed logsheets can be created for:

  • Every workstation in production or the lab.
  • Specific roles (technologist, quality officer, manager).
  • Specific purposes (energy monitoring, water consumption, mass balance, yield calculation, microbiology, etc.).

Key users without IT knowledge can configure logsheets themselves after a short training, using a simple configuration menu. Therefore, no IT knowledge is required!

Depending on the size and diversity of a production site, there can be anywhere from twenty to over a hundred logsheets. Every data point from the database can be found in one or more logsheets.

In HAI, the automatic data collection setup automatically leads to visualization in a logsheet. This means that all collected data is always visible in real-time!

Contextual graphical information helps answer the "why" and "how" questions, providing a deeper understanding of the data.

Uncover powerful insights by trending the data in any type of chart, combining related data from different sources  to understand correlations, deviations and patterns. Investigate historical trends, or alternatively present real-time trending to identify deviations as they occur.

Create automatic real-time reporting by defining calculated parameters and presenting them in a logsheet. Examples of logsheets that contain calculated variables are Batch reports,  Yield calculations, Mass balance reports, Loss calculations, Line speed calculations, OEE calculation, Recovery, First Tme Right rates, and other KPI’s.


Some other examples:

  • Exception Reports to report any non-conformances.
  • Adherence to Plan reports
  • Electronic Batch Record
  • Certificates of Analysis (COA) reports
  • Utility consumption reports, like water, electricity, gas.
  • Cleaning In Place (CIP)-reports
  • OEE report
  • Yield per batch
  • Tracking & Tracing
  • Technology Report

Create ad-hoc reports and analysis by applying advanced filter options (without the need to define queries), and simply export the results to for instance MS Excel for further processing and analysis.


Apply Statistical Process Control (SPC) or Statistical Quality Control (SQC) as part of the HAI-LOGSHEET, to identify process- or quality-deviations before they occur. This helps operators to understand when they need to take action to prevent non-conformances.

Calculate your Process Capabilities (CP or CPk) to understand to what extent the factory can meet the (customer-) specifications.

A Golden Batch is defined as the time-based profile of the process parameters that were recorded for a particularly succesful batch, in terms of duration and quality.

HAI facilitates the definition of a Golden Batch and operator real-time monitoring of the current batch versus the Golden Batch.

Moreover, Process Technologists use Golden Batch Reporting and Analysis to maximize process efficiency.


Calculate your Overall Equipment Effectiveness (OEE) metric to identify the percentage of planned production time that is truly productive. In other words: the performance of a production line or shift. Apply a special operator front-end to allocate down-time reasons and view real-time OEE metrics and downtime analysis.


Define the data-points that will be used by external visualization or analytics programs. Once that the Analytics Base Tables are defined, there is no need for manual interaction to let the data flow.

This feature is often used to create dashboards in Power BI, or provide data for advanced analytics purposes.


Define your high volume (high frequency) data, to be stored in a time-series Influx DB database and make sure all high frequency data remains available for the sake of batch release, track and trace, and research issues. Use the high-volume data for trending, reporting and analytics. Define the period that the high-volume data needs to remain accessible.

In parallel, a compressed version of the high-volume-data will be stored, contextualized with other data, and remain available at all times in the event-based database.


Having a structured, real-time contextualized database in HAI, the possibility of applying AI type solutions come within reach. That’s why HAI facilitates an automatic data load to an analytics program, for instance to develop a predictive model.

Once, such a model has been developed and tested, it can be put to use  in the HAI-LOGSHEET, which makes the model part of the daily operations. Through a continued (user)feedback loop to the original AI model, there is a continuous improvement cycle for the model.

Unlock the power of your data, by applying the Advanced Analytics Capabilities to discover and develop advanced control models that are incorporated as a Smart Factory App as part of the HAI-LOGSHEETS. The app supports plant personnel with process adjustment advices.


A Smart Factory App has been developed to improve sustainability, quality and yield in cheese production (1% yield improvement reflects an amount in the range of 100,000 – 500,000 euros a year). More information: https://hai.nl/news/hai-wins-with-team-notilyze-sas-hackaton-2023/

Another appealing example is a Smart Factory App to reduce energy consumption (and CO2 emissions) on a destillation process, while optimizing for quality and yield. More information: https://hai.nl/news/winning-the-worldwide-sas-hackaton/


Use the alarm module to define in which situations an alarm should be raised  for whom, and what workfow applies to this particular alarm.

Never miss an alarm, and never doubt on what actions need to be taken.