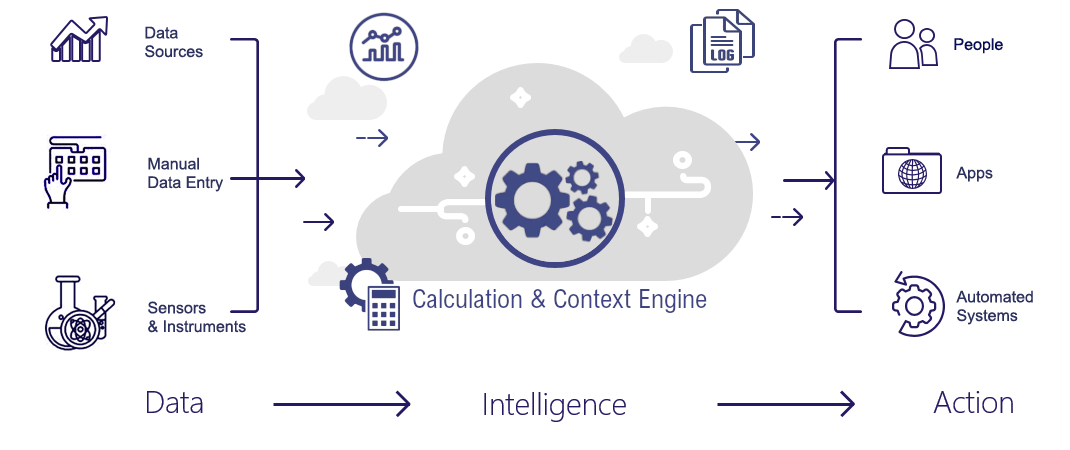
The HAI software is an easy tool to facilitate a true digital factory or a paperless plant. The HAI dashboards smartly combine manual data entry with automatic data collection from factory automation and (lab) instruments.
Operators use the manual HAI data entry fields to complete start-up checklists and enter downtime reasons, operator quality control test results, operator logsheets, etc. Operators use the HAI compliance dashboards to monitor data from other sources in real-time. Examples are processing conditions (setpoints and actual values, machine status, CIP-information), instrument data (e.g. weighing scales), lab test results, or real-time KPI’s (key performance indicators).
Lab technicians use the HAI manual data entry fields to enter product quality test results, hygiene test results, and CCP’s (critical control points). They use the HAI compliance dashboards to monitor data from other sources in real-time. Examples are processing conditions (setpoints and actual values, machine status, CIP-information), instrument data (e.g. weighing scales, in-line product quality measurements), operator product quality test results and data from external labs.
Digital batch records facilitate a smooth and reliable batch release.
Production and Quality managers use the HAI dashboards to monitor production and quality compliance in real-time. Also, they use the HAI software to view, report and analyze historical factory and quality data.
Engineers and Technologists use the HAI software to analyze historical plant- and quality data. Plant data may include data on CIP (Cleaning in Place), utility consumption, climate data, etc. Additionally they implement automatic process adjustment advices as part of the operator dashboards.
The HAI software contains information on product quality, processing conditions (temperatures, flow rate, speed, time of residence, etc.) and production volumes. This information is shown in real-time and matched against specifications. Thus, compliance of quality, processing and production is monitored in real-time.
Dashboards give real-time information on trends and Key Performance Indicators (KPI’s) like OEE (Overall Equipment Effectiveness), Quality Performance, Adherence to Plan, etc.
OEE metrics are calculated in real-time to track speed losses, quality losses and downtime losses. Analysis of downtimes, speed- and quality losses is important to understand how to improve the Availability Rate, Performance Rate and Quality Rate.
Trending of quality characteristics, process parameters, and in-line test results helps operators and process engineers to prevent out of spec and improve product quality consistency.
Statistical Process Control features support further process improvement.
HAI offers Smart Factory Apps and Industry Analytics-as-a Service. For instance, HAI performs data analysis on a complex and capital-intensive process like a spray-drying installation. Based on the analysis results, HAI develops a “smart factory app” to monitor the spray drying process and identify anomalies.
Another example is Analytics-as-a-Service where the data is not restricted to one specific production unit or plant. In this example the data may come from different locations like supplier contextual data, or customer application data.
For the development of this type of applications, HAI has all the necessary tools and expertise in place to perform such analytics: a cloud connectivity infrastructure, a flexible database, a powerful analytics platform, data analysis experts and industry expertise. This means that customers do not need to make high up-front investments in infrastructure and software. They simply benefit from this ready-to-use infrastructure against a monthly fee. This is part of the “As-a-service” subscription model.
For Internet of Things, Smart Factory Solutions and Factory Analytcs, it is vital to work with the latest cloud technology applications. As one of the first pioneers in cloud software for factories, HAI has a high degree of experience in this domain. The HAI software has been developed using Microsoft Technology. Awarded as “Cool Vendor for Manufacturing” by Gartner, HAI has received recognition for its technological and functional achievements.
Especially for companies using SAP as their ERP system, HAI developed SAP-connectors. This includes SAP certifications.
Especially for companies using OSI PI System for plant data collection, HAI offers connectivity to OSI PI System.
HAI uses web services to collect the data in a central cloud database. HAI has developed a lot of know-how and tooling to connect all types of systems to its central cloud database: this may concern data coming from SCADA/PLC (process control systems), factory historians, in-line test instruments, product quality test equipment or other databases.
Connections to ERP business systems from SAP, Infor or Microsoft are done by reading data from ERP (production orders, quality inspections, planning, etc.) and providing feedback on production order completion and quality inspection results.
ISA-95 compliance facilitates vertical and horizontal integration with other applications.
The software is available in the Cloud in a Software-as-a-Service subscription model.