Case study: HAI software a powerful add-on to OSISoft PI System
Case study: HAI software a powerful add-on to OSISoft PI System
The combination of OSI PI System with HAI’s software proves to be a great success. In the mozzarella and cream factory of Royal A-ware in Heerenveen, they connected the factory data in PI System to HAI’s smart dashboard software. Actemium played a key role in implementing OSI PI System and HAI.
The combination OSI/HAI is so successful that Actemium is now also implementing this in other factories. In this interview, we hear from Royal A-ware why they made the choice for OSI/HAI, and why they are so happy with it.
When visiting the production area of the mozzarella/cream plant, we see dashboards and input screens everywhere. That is how operators see at a glance whether the factory is running well and whether the quality is good. In addition, they see the operator control checks they need to perform. Ype de Jong, site manager, shows us around, along with René Danker, consultant at HAI.
More than just factory data
Royal A-ware wanted to have a good view of all the details of the production process. That is why they chose PI System to log and trend all their factory data, which works fine.
Yet for Royal A-ware, this was not enough. Ype explains: “at Royal A-ware’s other (Gouda) cheese factory in Heerenveen, we work with the HAI software. With the HAI software, we go a few steps further: with additional dashboards, operator input screens, reports, and analyses. Therefore, the bar was set high. We wanted that same functionality for the mozzarella/cream plant. That’s why we asked HAI to connect the HAI software to PI System.”
Convenient for operators: input fields and process control combined in one screen
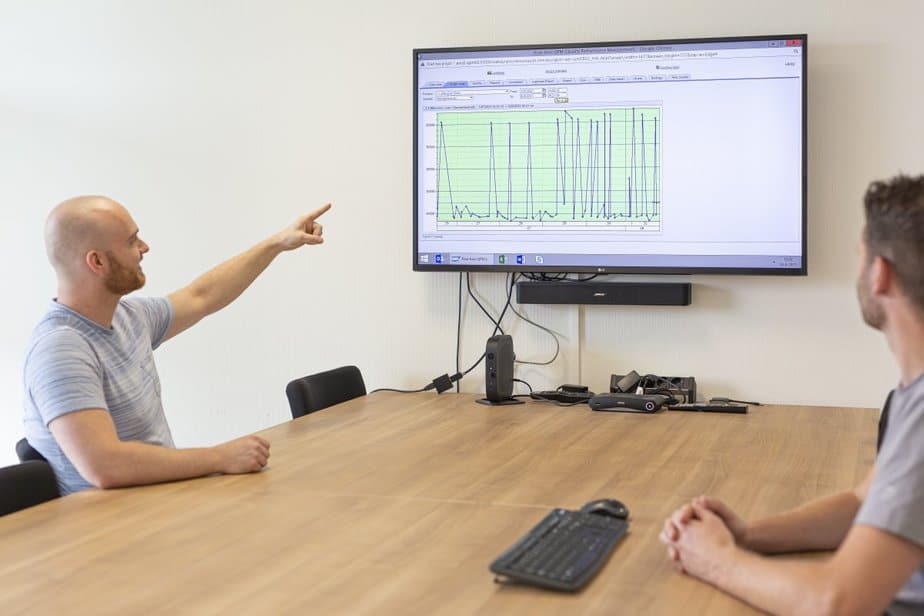
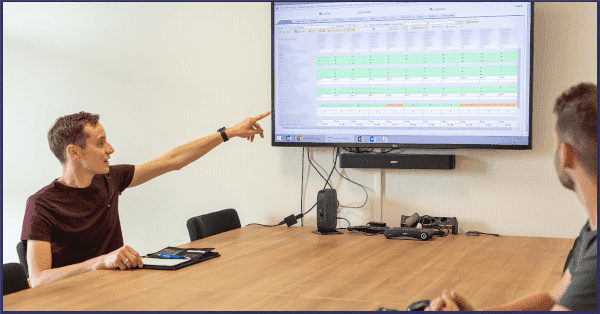
This turned out to be an absolute success. Ever since they added the HAI software, Ype and his colleagues are still happy to have added the HAI dashboards. René Danker, together with Rick van Uden from Actemium, connected the HAI software to OSI in just a few days. Since then, the PI System factory data automatically flows into the HAI dashboards. Using color codes, the operator immediately sees whether the measurements are compliant with the process and quality specification limits.
In the same dashboards, René configured input fields for the operator process- and quality-controls. Now they have the automatic plant data with their compliance, combined with the operator controls in the same HAI dashboard. This is great for entering manual operator control checks, but it also provides a much better overview. Operators no longer have to switch screens but can see everything at a glance.
Farewell to Excel sheets for operator controls
The operator controls are now an integral part of the operator dashboard. That is a big relief, because now operators abandoned a whole series of Excel sheets they used before. These Excel sheets included, for example, operator hourly checks, quality checks, metal detection, weights, X-ray or core temperature. Operators now also easily add explanatory texts in the new HAI dashboards. Think of a downtime protocol, or explanatory texts referring to deviating process conditions.
“Eventually”, says Ype, “I want to get rid of all the Excel sheets in the factory. They cause a lot of trouble because they are not secure and cannot be used by multiple users at the same time. Also, they are sometimes not stored properly, or the files become too large to process properly. Ype and his colleagues are therefore relieved that they replaced many Excel sheets by the HAI dashboards. “Excel is simply not a business system to run your factory.”
Real-time automatic reports
Some of the data in the HAI dashboards is calculated automatically. Sometimes this involves a simple calculation from liters to kilograms, or a calculated average per half hour. Or, for instance, the cumulative volumes per shift. In other words, it is a kind of real-time reporting.
“Perhaps that’s the key to this success: that all employees easily access information, without an IT department having to create reports for each specific purpose.”

Easy retrieval of information on process-, quality-, or operator-controls
Sometimes it is necessary to retrieve information from produced batches. In the HAI software, they look this up easily: whether it is about milk composition, production conditions, the checks performed by operators or production volumes.
Not dependent on IT people for analysis and reporting
Technologists also make extensive use of the HAI software. The HAI software automatically calculates all kinds of key figures for them with which they monitor the process. This may involve a simple calculation of preparation time or residence time. It could also be about a calculated moisture, fat or protein content. To this end, you need not only production data, but also quality data, which can also be found in HAI. These reports are made without programming. René: “If you have basic Excel skills, then you can also do it yourself in the HAI software”.
Get inspired
Interested in more best practices of smart use of factory data?
Get inspired by the successes of others when it comes to real-time monitoring of quality and production data, OEE, positive release, golden batch, CIP-cleaning, operator support, factory data anaytics, in-line measurements, factory dashboards… and much more.
Do not miss it and follow us on LinkedIn:


