Royal A-ware’s new mozzarella/cream factory optimal digital
Royal A-ware's new mozzarella/cream factory optimal digital
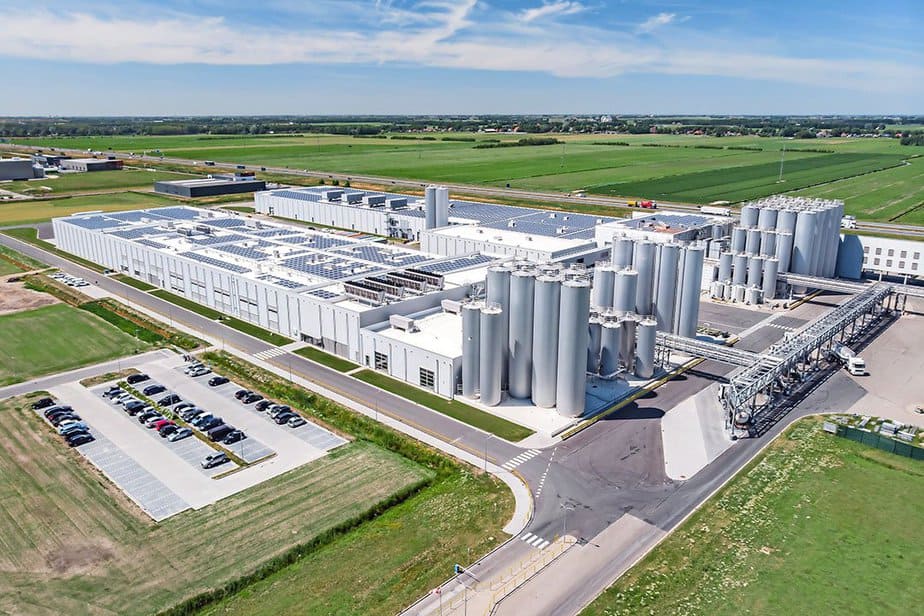
A brand new factory, and a new dairy product that no one in the Netherlands had any experience with. Yet Royal A-ware looks back on a successful start-up of their new mozzarella/cream factory. That was thanks to very thorough preparations, also in the area of digitalization.
“You have to do more than just digitally store all the information about production and quality. You have to ensure that this information is also easily accessible to everyone, preferably in real time. We have set the bar high and are still reaping the benefits every day.” We are interviewing, Ype de Jong, site manager of the new factory in Heerenveen, the Netherlands.
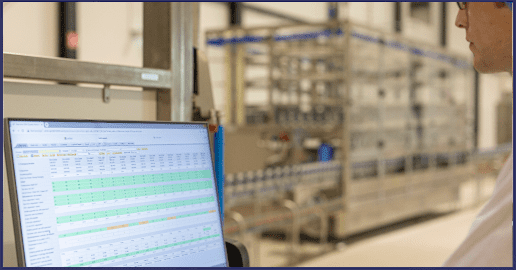
At many workstations in the factory we see HAI dashboards and input screens. Here, operators and managers see at a glance whether the factory is running well, whether the quality is good, and which checks they need to perform. Ype shows us around, together with René Danker, consultant at HAI. Subject of conversation is how digitilization helps them in the production of mozzarella and cream. Their story turns out to be surprisingly multifaceted.
First mozzarella/cream-factory on Dutch soil
It’s been more than a year ago since the factory actually started producing. Starting up a new factory is always exciting, but in this case, there was an extra dimension to it. After all, this is the first mozzarella/cream factory on Dutch soil. Therefore, it was new for everyone. That’s precisely why it was so important to have access to factory data right from the start. For, in the event of a quality deviation, they quickly check the data from the production process. Then even the smallest detail counts. That is why they chose PI System to log and trend all their factory data. This gives them insights into start and stop timestamps, temperature, pressure, flow, residence time, and so on. In the real-time dashboards of the HAI software, they can easily monitor and retrieve this information.
Process- and quality monitoring
Monitoring your production process also includes manual process and quality control records. After all, this is how you ensure that, for example, the start-up checks are carried out properly and the hygiene rules are followed properly. And, above all, whether the product quality checks are compliant. “These operator records were initially set-up in Excel, but nobody was happy: too much issues with accessibility, security, incorrect saving, and files that became too large,” says Ype.
Smart dashboards
Therefore, they decided to set up the operator and quality control records in the HAI software. The result is a smart dashboard combining a real-time view on factory data, along with manual data entry of operator checks and test results. Hence, operators only have one single screen to monitor their process and to see what checks they need to do. In addition, operators identify any non-compliance, through automatic color codes.
Operators also add explanatory texts to the automatic factory data. For example a downtime explanation, or notes referring to abnormal temperatures. In the filling and packaging department, operators perform a series of checks every hour. They use HAI’s input screens for this purpose as well. Same as for regular checks on metal detection, X-ray, weight control and core temperature.
Automatic conversion from liters to kilograms
Thus, the HAI dashboards show real-time factory data along with manually entered operator checks and tests. In addition, Royal A-ware uses another feature: the formulas. The formulas enable to automatically perform calculations with the data. Royal A-ware uses this, for example, for an automatic conversion of liters to kilograms, or a calculated average per half hour. Or for cumulative volumes per shift. Actually, these are a kind of real-time reports.
Quickly look up information
Sometimes it is necessary to look back at information from batches produced. In the HAI software, they look this up easily: whether it’s about milk composition, processing conditions, or the checks operators have performed.

Technologists: calculated contents of moisture, fat and protein
Technologists make extensive use of the HAI software as well. The HAI software automatically makes all kinds of calculations, which they use to monitor and evaluate the process. This varies from a simple calculation of preparation time or residence time to a calculated moisture-, fat- or protein-content. To this end, you need to link the data about the composition and weights of the mozzarella, cream or whey to the right part of a batch.
“This is a challenge because part of the production of mozzarella is a continuous process instead of a batch-process. Yet, we did manage to implement these automatic calculations,” says René.
He also gives other examples of calculations, such as the technological efficiency on whey cream.
A major advantage is that once you have set up certain calculations, they always continue to run automatically.

Mass balance insights
The Planning department uses the HAI software to keep track of the various milk and whey flows and how they are distributed over the various tanks. An ERP system records receipts and deliveries per batch, but it does not know the details at tank level. “So this helps our planners to have a more detailed view over all the tanks,” says Ype.
ER (Emergency Response), Training matrix and Audits
Ype and his team are happy with the HAI software. “But we’re not ready yet,” Ype emphasizes. “And maybe we never will be. Eventually,” says Ype, “I want to get rid of all the Excel sheets in the factory.”
They managed to eliminate many Excel sheets by implementing them in the HAI system. Among these are also records about ER (emergency response), QA related records, and a Training Matrix. “If an auditor comes in, he’s got an easy job checking our records”, Ype laughs.
Get inspired
Interested in more best practices of smart use of factory data?
Get inspired by the successes of others when it comes to real-time monitoring of quality and production data, OEE, positive release, golden batch, CIP-cleaning, operator support, factory data anaytics, in-line measurements, factory dashboards… and much more.
Do not miss it and follow us on LinkedIn:


