Turning Data Into Actionable Insights
How factory teams really get a grip on their process
Turning Data Into Actionable Insights
How factory teams really get a grip on their process
In conversations with Plant Managers and Production Leaders in the Food Industry, it comes up again and again: everyone wants more control over the process, but the proliferation of Dashboards and Excel sheets does not seem to be the right approach.
The wish is clear: “Give me the information I need right now — in a way I can understand and immediately act on.”

How do we make the data useful
More and more, the discussion is shifting away from collecting data, and towards making it useful for the people who actually need to act on it. “It’s not about after-the-fact reporting — it’s about real-time insights on the shop floor.”
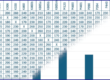
Think live trend analyses and alerts that predict whether quality targets will be met during production. Or automatic KPI calculations for OEE, mass balance, or batch yield. All in real time — not just afterward.
“Give me the information I need right now — in a way I can understand and immediately act on.”
Actionable, Accessible Information
This is what Americans refer to as “democratized data access”:
Insight shouldn’t be limited to management. Operators, shift leads, and process technologists need to be in control too.
But that only works when the information is not just correct, but also easy to understand and clearly geared toward action.
Interactive by Design
Delivering this requires a robust data architecture:
✅ Reliable, standardized data with strong governance as a foundation
✅ Flexible and user-friendly presentation
✅ And most importantly: interactivity.
A dashboard only becomes truly valuable when you can add context — explain why the line stopped, record what setting was changed, or leave a note for the next shift.
This is the Future of Digitalization in the Factory
At HAI, we believe this is what factory digitalization should look like. With the HAI Cloud Data Platform, we ensure that employees at every level have real-time access to the right information — from deviation signals and live trends to automatic mass balances and performance KPIs.
Our dashboards don’t just show what’s happening — they make it easy to enrich data with insights and context. This allows teams to adjust quickly, reduce losses, and continuously improve their processes — step by step, every day.
Get inspired
Interested in more best practices of smart use of factory data, in the Food, Chemical and pharmaceutical Industry?
Get inspired by successes of others when it comes to software to facilitating a data-driven approach, a digital factory with A.I., OEE, quality, positive release, golden batch, CIP-cleaning, operator support, factory data anaytics, in-line measurements, production & technology dashboards… and much more.
Don’t miss a thing and follow us on LinkedIn: