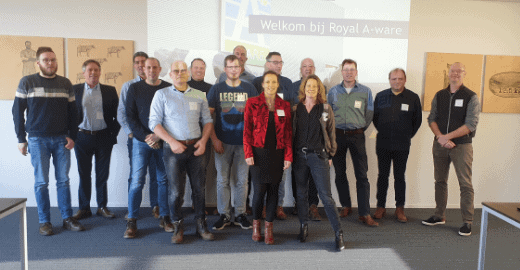
Visiting cheese factory of Royal A-ware in Heerenveen
A group of HAI customers gathered at the cheese factory of Royal A-ware in Heerenveen in February 2020.
Delegates from DSM, Yakult, Euroma, Elopak, NewItera, HAI, Aviko Rixona and KraftHeinz obtained an impressive insight from the cheese factory. Royal A-ware showed how they use the HAI software to continuously monitor their production processes and product quality.
No mention of difficult terminology like Industry 4.0 or Smart Digital Factories, but instead simple and straight forward data collection. Visualized in a fair number of dashboards and all kinds of trending.
It concerns data on product quality, production volumes, processing conditions, yield, tank contents, CIP-cleaning, OEE-calculations, hygiene monitoring and mass balance.
It became clear how the whole factory team benefits from this information in their daily operations.
Reading data from many different systems
Royal A-ware uses the HAI software to its full extent to closely monitor the production processes and product quality. The production process starts with milk processing, followed by cheese production, brining, coating and ripening. For each of these production phases, the data is automatically collected in the HAI software, for example: start- and finish time stamps, temperatures, flows, volumes, CIP-cleaning activities, etc.
It includes also external lab test results from Qlip dairy lab (click here for more information about connectivity between HAI and Qlip).
Operators and quality engineers add their own controls, checks, test results and comments in the HAI manual data entry screens: directly into the HAI*QPM database.In this way they have all factory and quality information in one central database. They monitor these data in real-time in the HAI dashboards.
Real time dashboard
HAI*QPM does more than merely visualize the collected data for the cheese factory. It automatically calculates reporting dashboards in real time. For example: cumulatives per batch, per shift or per hour. It converts automatically liters to kilograms, and it calculates the full percentage of cheese composition. Trends show how the calculated figures compare with historic data.
The system includes more than 4.500 different variables, that are monitored or calculated continuously.
One of the delegates concluded that this is a type of real-time reporting. Yes indeed, A-ware responded: “we have eliminated part of our standard reporting requirements, by creating these real-time calculated dashboards.” With these real-time calculations and KPI’s (Key Performance Indicators), we can immediately identify any anomalies or non-compliance.”
Royal A-ware emphasized that it also speeds up their remaining standard reports. After all, much of the required data is “prepared” and ready for use in reports.
Cheese technologist and HAI key-user
Key-user of the HAI software at Royal A-ware is Sjoerd van der Wal, junior cheese technologist. He independently designs new data entry screens, dashboards and reports in HAI*QPM. His passion is and remains cheese, and the HAI software is no more than a tool, albeit a very valuable one.
He knows like no other which information helps to ensure cheese product quality. Or which information you need to optimize the production processes.This stands him in good stead as a key-user for HAI*QPM.
Inspired delegates
How this is done: the production of great cheese? That became clear when the delegates were given a tour of the plant to conclude the event. All in all, it was a fruitful and inspiring event. Practically all delegates have started to expand the use of the HAI software at their own factories.
Advice for process corrections & Reliable mass balance
Operators and quality engineers use the information in HAI*QPM o.a. for monitoring of quality and process compliance, and even for an automatic calculation of corrective settings in case of process deviations. The planning department has a real-time view on tank filling and production progress.
Technologists and managers use the information in HAI*QPM for recipe optimization, yield calculations, quality reports, trending, OEE reporting and CIP-cleaning optimization. And, of course, also for a reliable mass balance, that makes clear what happened to each individual litre of milk: it ended up in great cheese!
Get inspired
Interested in more best practices of smart use of factory data, especially in the Food Industry?
Get inspired by successes of others when it comes to OEE, quality, positive release, golden batch, CIP-cleaning, operator support, factory data anaytics, in-line measurements, factory dashboards… and much more.
Do not miss it and follow us on LinkedIn:


